Runoff Lab NX brings the entire hydrological workflow to your browser — from the rainfall series to the flood hydrograph — and introduces AI Import: drop a yearbook PDF in, the artificial intelligence reads the document and populates the station in seconds. It’s the first web application of the new GeoStru NX suite.
The analysis of annual maximum rainfall and the construction of flood hydrographs sit at the centre of every hydraulic project. Historically, they have also been one of the most repetitive activities: loading rainfall data, picking the distribution, regression, generating the hyetograph, SCS-CN convolution, exporting the report. Decades of consolidated methodologies, but also of manual copy-paste and spreadsheets to be re-tuned for every project.
GeoStru Runoff Lab NX is the new web version of this workflow: it runs entirely in the browser, integrates four families of probability distributions side by side, imports rainfall data from PDFs through artificial intelligence, and talks directly to the Hydrogeo NX database of Italian rain gauge stations. The output, at the end, is a multilingual PDF report ready to deliver.
From your browser, no install required
Runoff Lab NX is a web application. It opens directly at geostru.ai, with no local installation. It works on Windows, Mac, Linux PCs or tablets with any modern browser. Projects are accessible and shareable across multiple workstations — useful both for office workflows and for engineers moving between site and client.
The interface is organised in five sections — Measurement station, Probabilistic analysis, Rainfall curves, Hyetographs, Hydrographs — corresponding to the five steps of the classical hydrological study workflow. Each section communicates with the downstream ones through a single project file, avoiding duplications and misalignments.
The Measurement station section collects the station registry (code, municipality, region, coordinates, years of observation) and the rainfall series for five standard durations: 1, 3, 6, 12 and 24 hours. Sample statistics — size, mean, standard deviation, coefficient of variation, skewness coefficient — are computed in real time as data are edited, and displayed alongside the main table.
Four probability distributions side by side
The core of any hydrological study is the estimation of the rainfall value for an assigned return period. Runoff Lab NX implements four families of distributions available in parallel, applicable simultaneously to the same series:
- Gumbel — with method of moments and maximum likelihood
- GEV (Generalised Extreme Value) — with Hosking-Wallis L-moments estimator, the modern reference recommended by the World Meteorological Organisation (WMO)
- Pearson type III — with the Foster-Kite method, standard in Eastern European hydrology
- TCEV (Two-Component Extreme Value) — at four regional levels, with the VAPI dataset preinstalled
For each family, the editor computes the estimated parameters for all durations in seconds. The four runs are displayed side by side in the same panel, allowing direct model comparison before choosing the return period.
Probability paper and rainfall curves
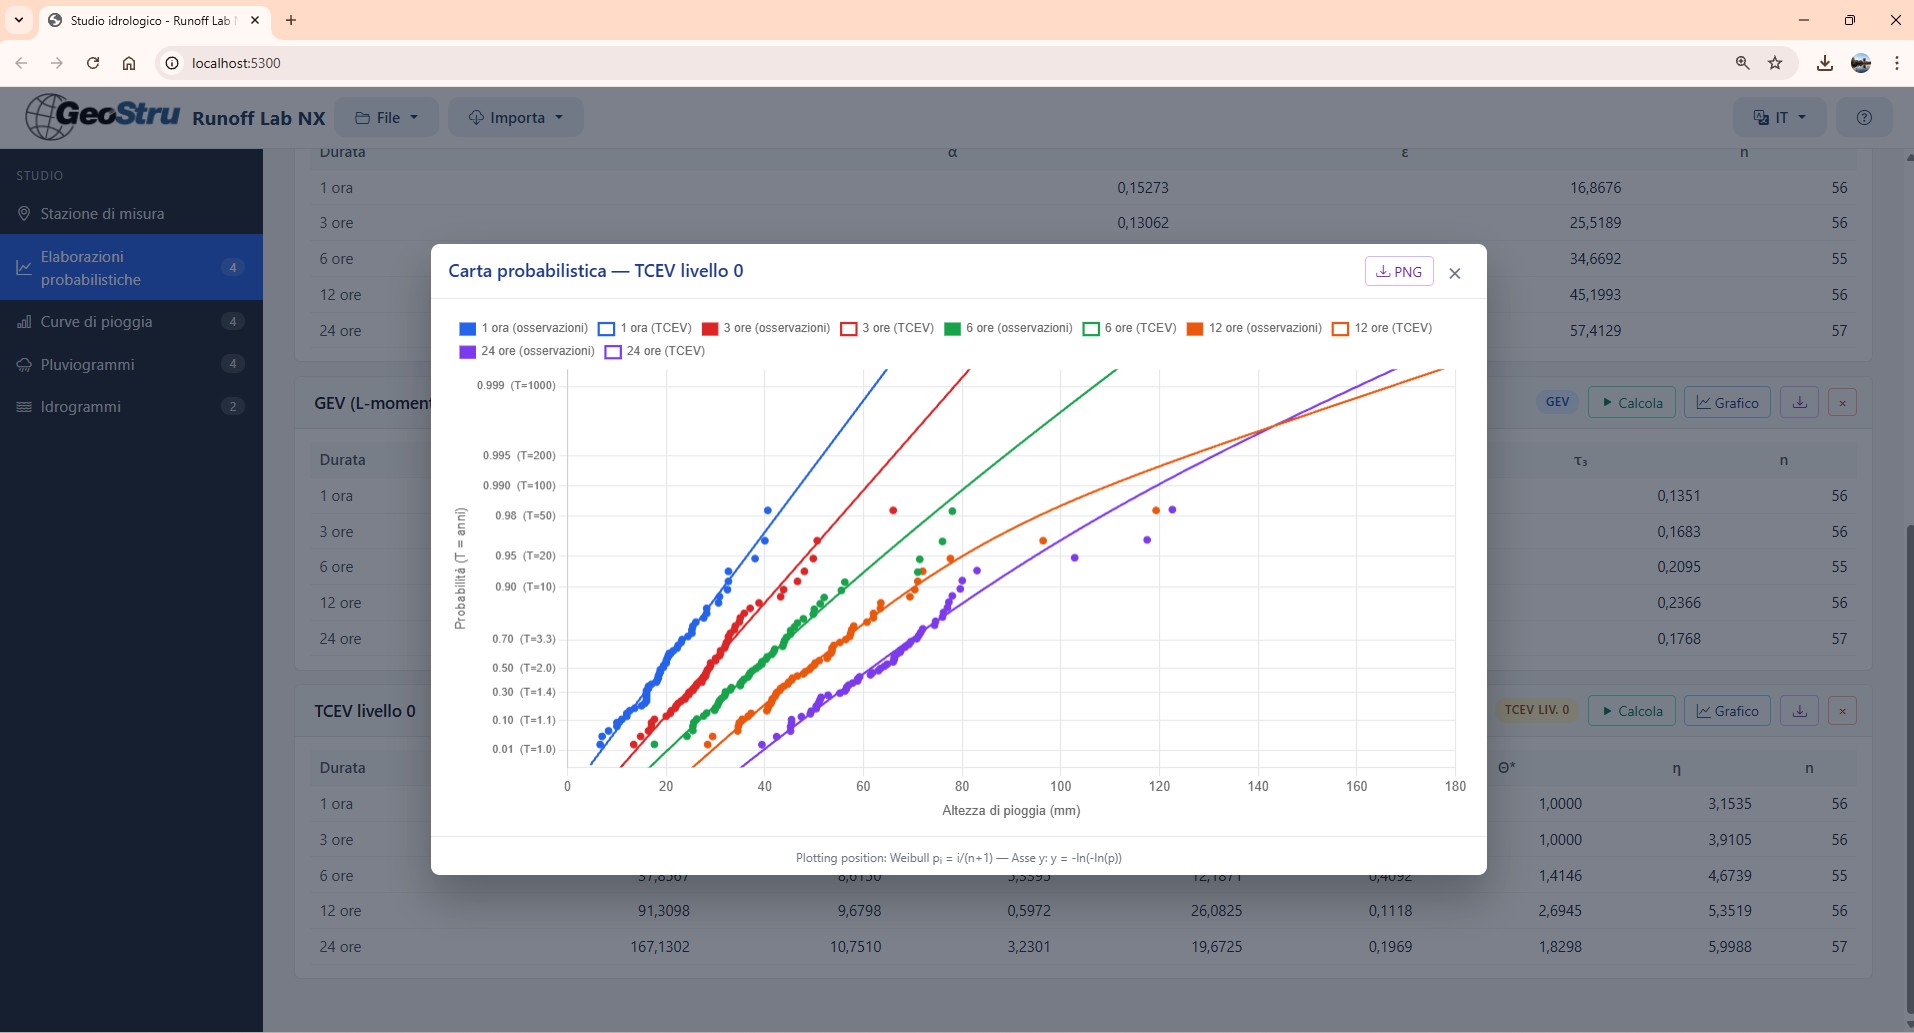
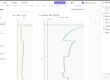
Clicking the Chart icon on any card opens the Gumbel probability paper, with Weibull plotting position over the observed data and the estimated distribution lines overlaid. An essential tool to assess at a glance which model best follows the right tail of the sample — the tail that, when computing high return periods, makes the difference between a conservative estimate and a dangerously optimistic one.
From any run, the IDF rainfall curve (Intensity-Duration-Frequency) is generated, in the classical monomial relation form. Log-linear regression in the logarithmic plane returns parameters a, n and the correlation index R in one second. For the Cosenza station used as case study in the tutorial, with a 50-year return period: a = 41.88, n = 0.29, R > 0.99.
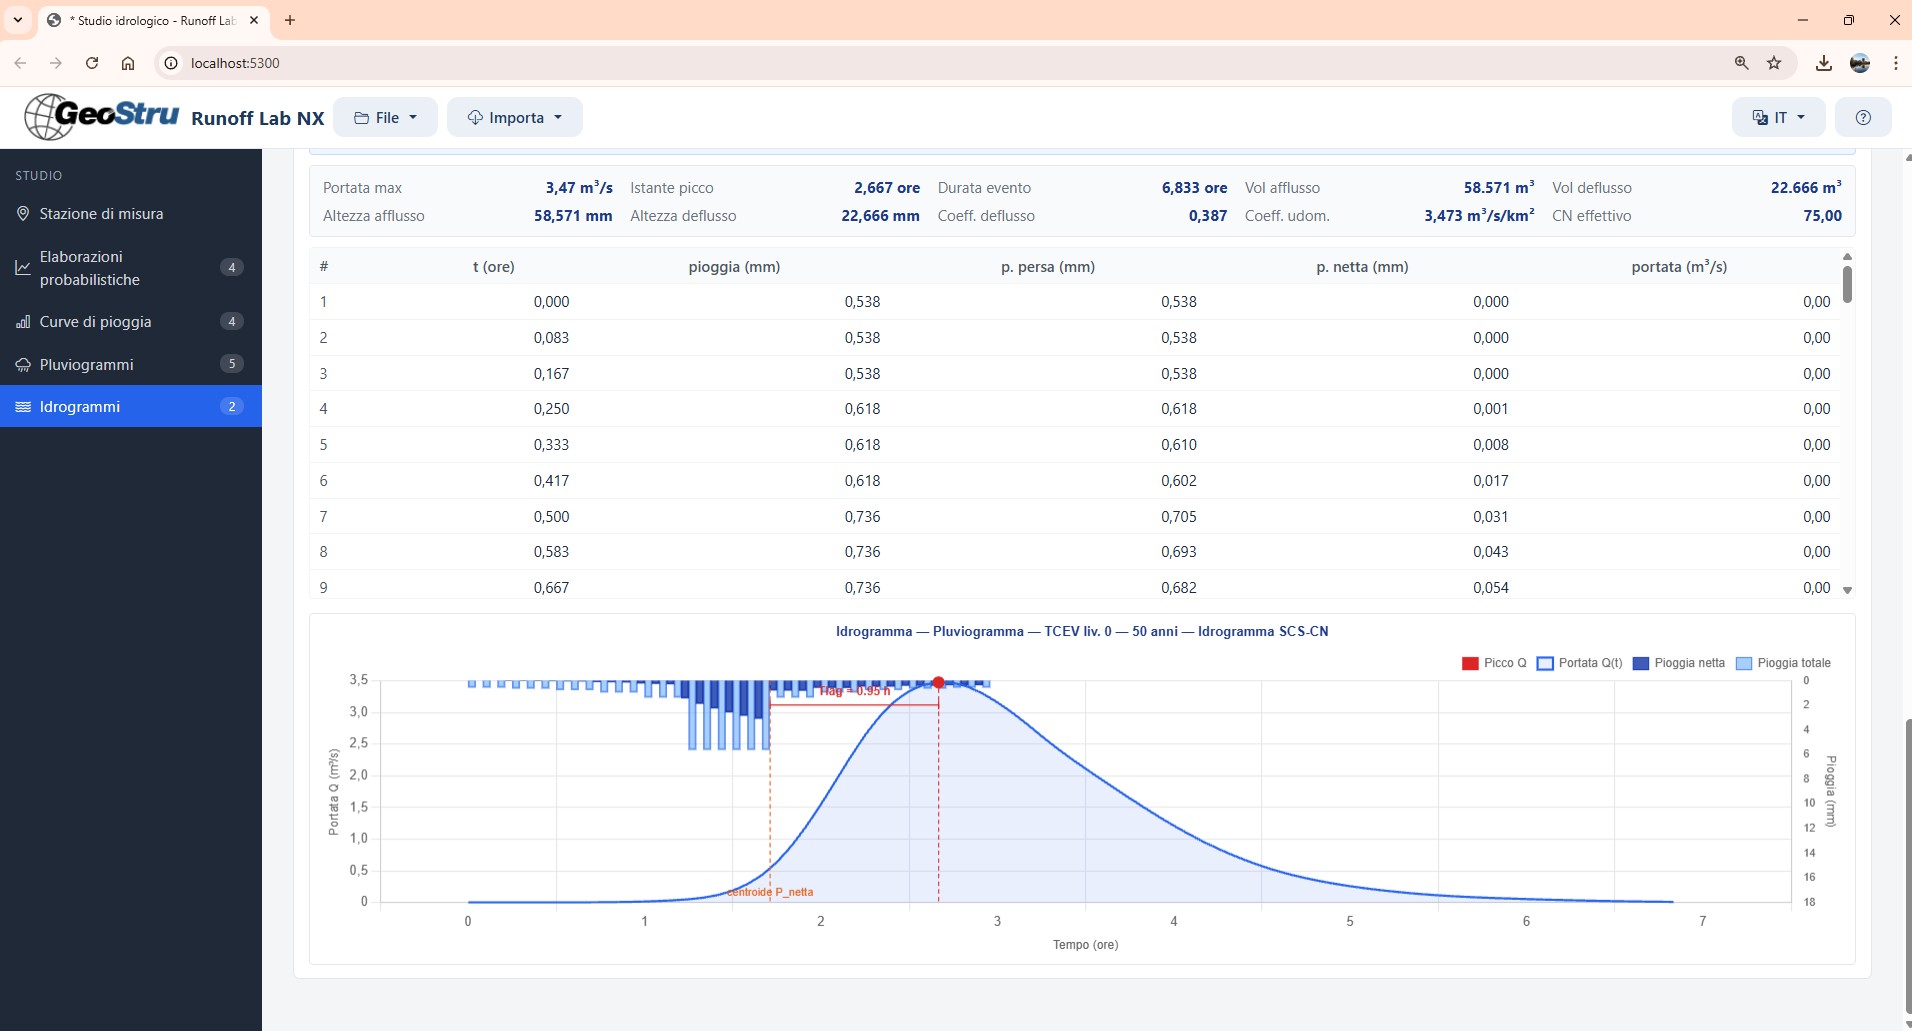
Synthetic hyetographs and flood hydrographs
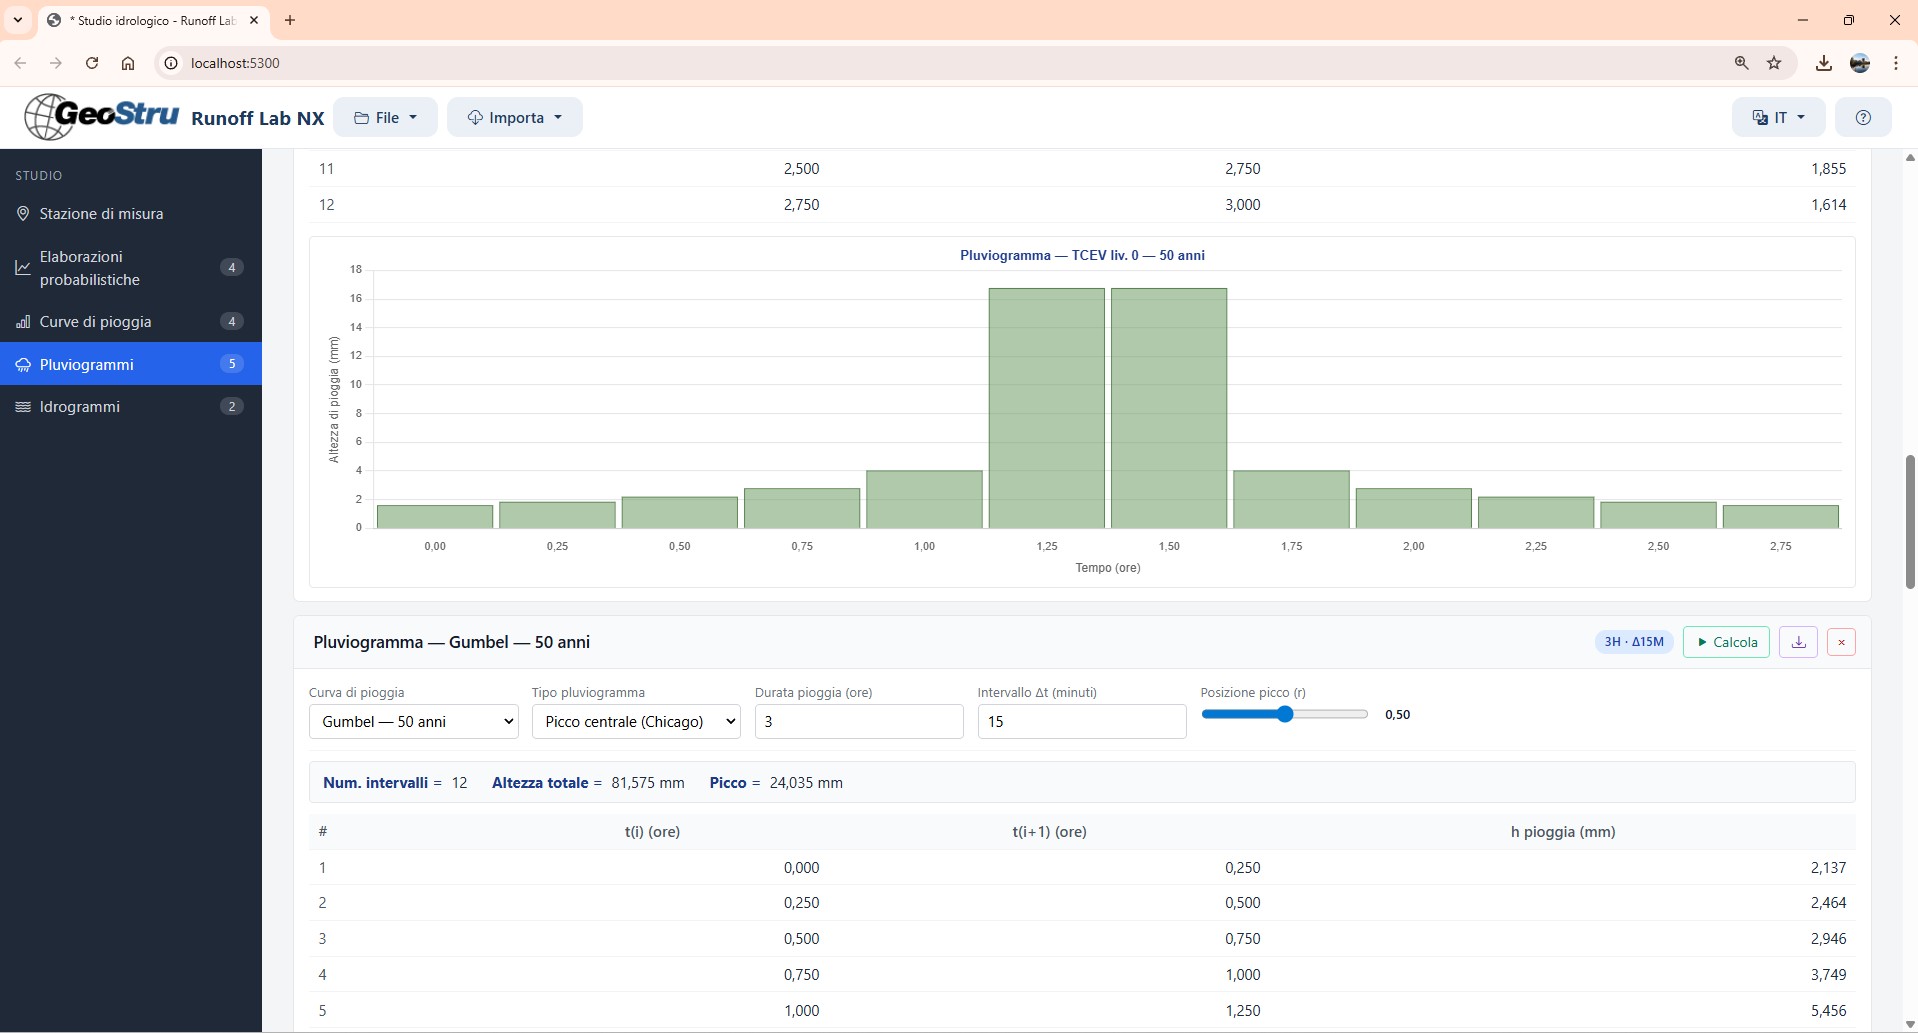
The IDF curve becomes the basis for the Chicago synthetic hyetograph by Keifer and Chu (1957). The user picks total duration, discretisation interval and peak position; the system builds a symmetric hyetograph in which every internal duration returns exactly the height predicted by the IDF curve.
The flood hydrograph closes the workflow, with the SCS-CN method. The model performs the convolution between net rainfall and the SCS dimensionless unit hydrograph, returning: peak discharge, time to peak, inflow and outflow volumes, runoff coefficient. Watershed parameters — area, time to peak Tp, Curve Number, V, computation interval — are adjustable in real time, with automatic recalculation.
AI Import: from PDF to a complete station in 10 seconds
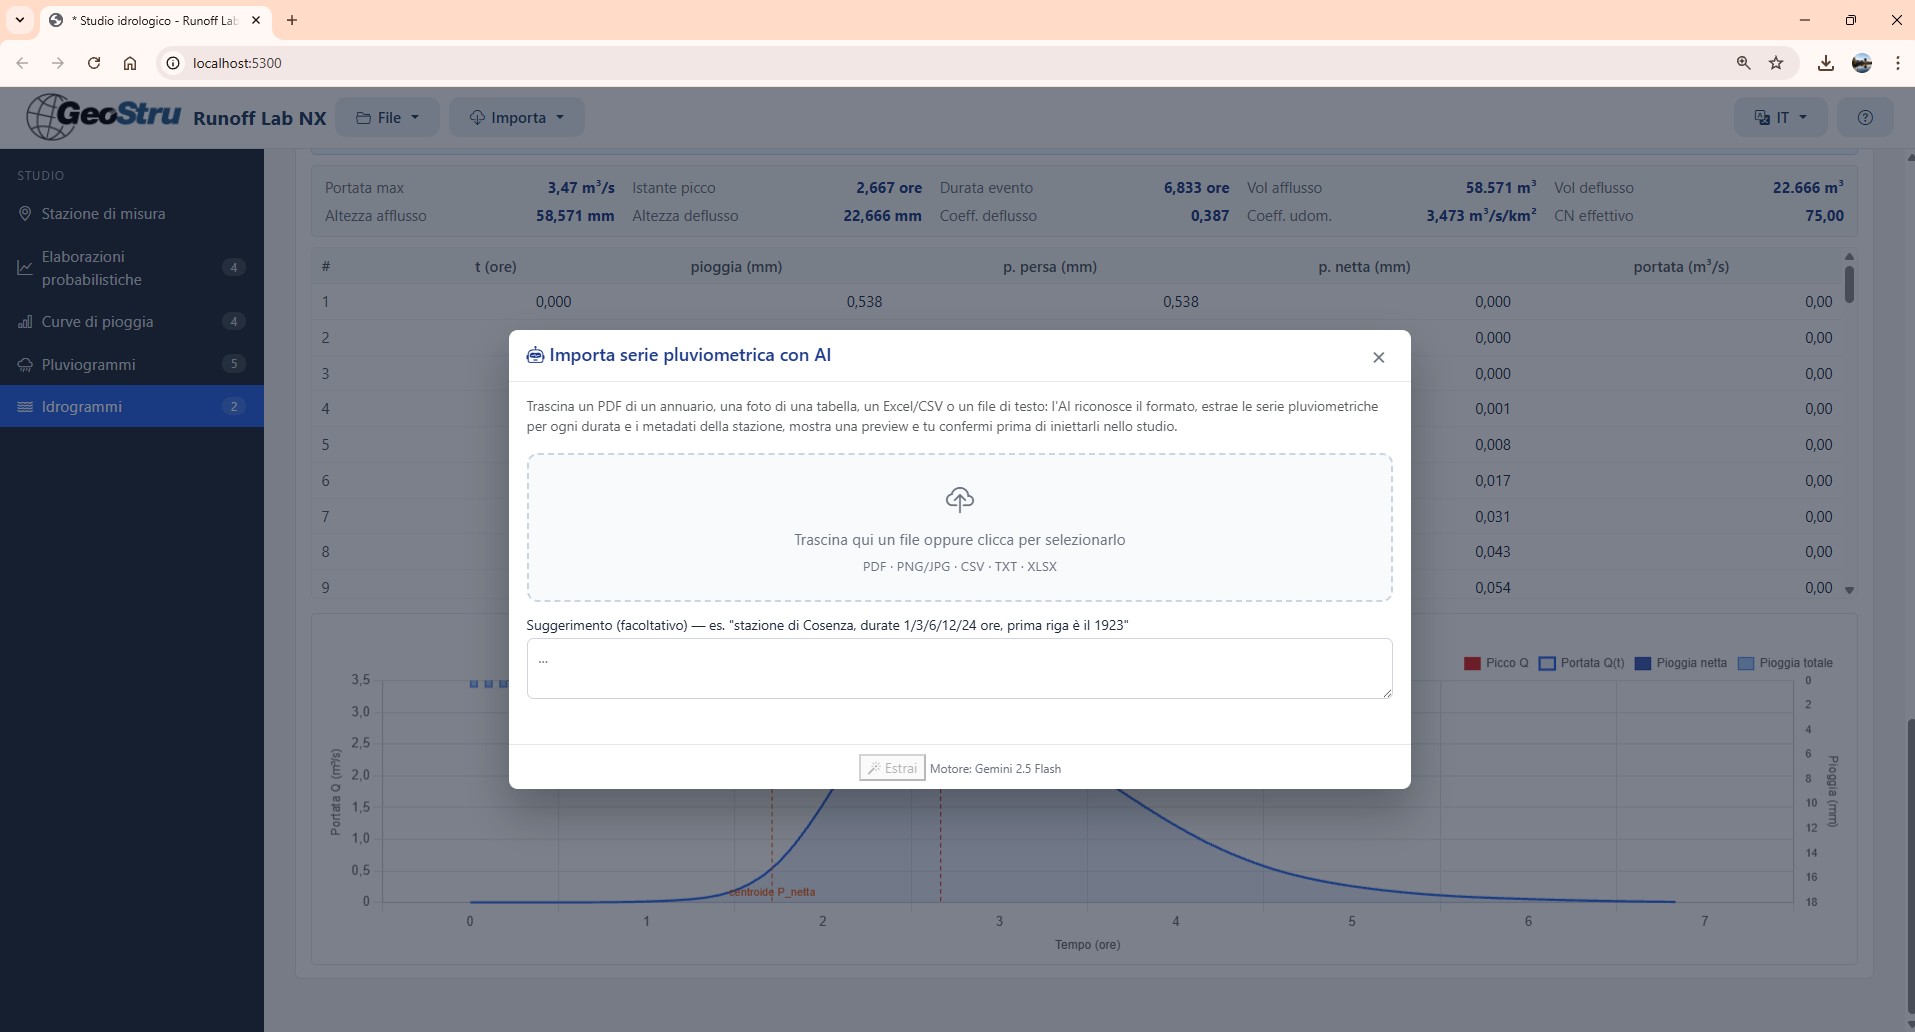
The novelty that radically changes the way a new station is created is AI Import. Every hydrologist knows the problem: archives of regional hydrological yearbooks in PDF, scans of paper tabulations, photos of historical publications, Excel files with merged cells and header rows that follow no standard schema.
Runoff Lab NX reads everything. From the Import with AI menu a modal with a dropzone appears: drop the file in (even if scanned as an image), and the artificial intelligence visually interprets the document. In seconds, a tabular preview shows exactly what was extracted: station name, code, municipality, region, years of observation, and for each duration the value count plus the first numbers as preview.
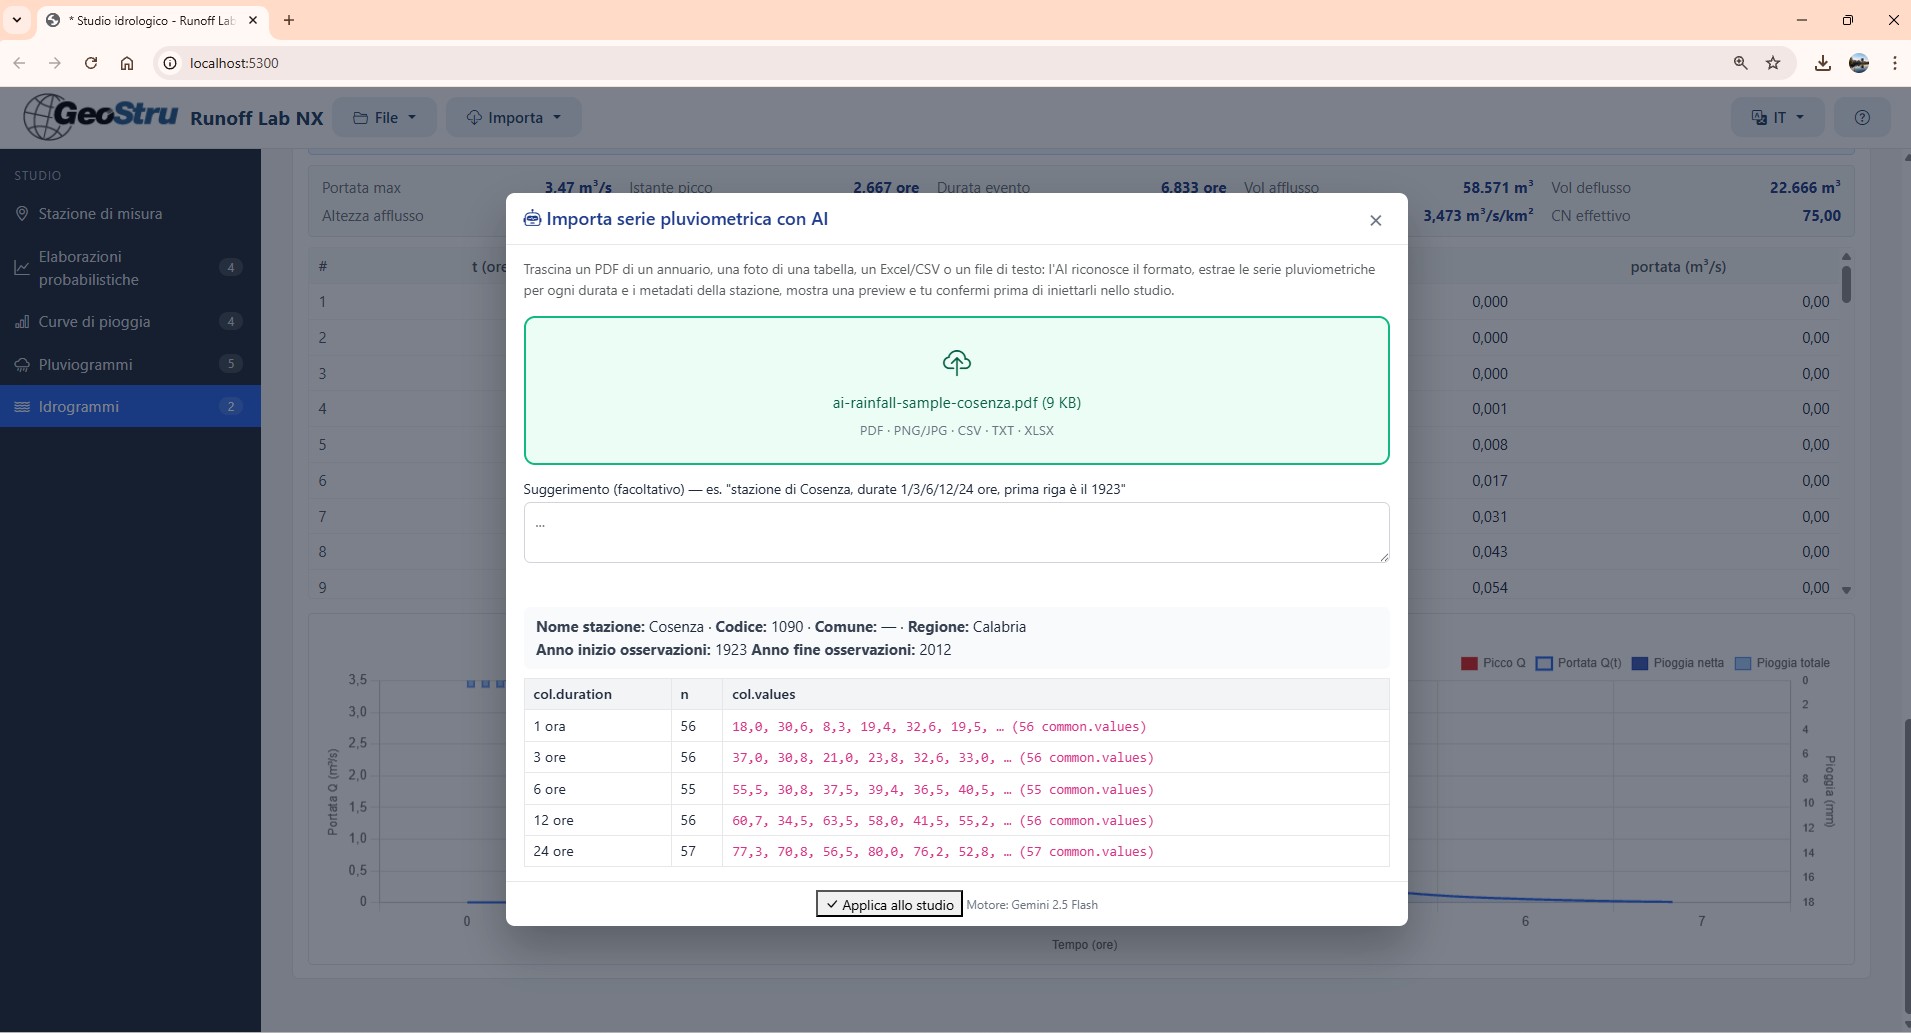
No fabricated data. If a column is ambiguous, the AI flags it in the notes. The user reviews the preview, confirms, and with one click 50, 100 or 200 values are inserted automatically into the correct rainfall series, with the right duration.
The workflow that used to take half an hour of manual copy-paste now takes about ten seconds.
A capability that has no precedent in the applied hydrology sector today.
Hydrogeo NX integration via API
Runoff Lab NX talks directly with Hydrogeo NX, the GeoStru companion service mapping all Italian rain gauge stations. Communication happens via API services: a click on the Hydrogeo NX map and the selected station is imported directly into Runoff Lab NX, with full registry and rainfall series ready for analysis. No copy-paste, no manual downloads, no transcription errors.
The start of the GeoStru NX suite
Runoff Lab NX joins Stratigrapher NX in the new GeoStru NX suite: a family of web applications that talk to each other through a single project file and through the Hydrogeo NX APIs. The next pieces coming soon are LiquiTer NX (liquefaction analysis), RSL III NX (local seismic response), Dinamiche NX (DPSH/SPT tests), Statiche NX (CPT/CPTU tests) and Laboratorio NX (laboratory tests).
The goal is clear: one study, data shared across all modules, no duplicate data entry.
Full tutorial (6 minutes) and free trial
The full 6-minute tutorial walks through the entire workflow — from AI Import to SCS-CN hydrograph generation — on a real case: the Cosenza station, Crati basin, with 66 years of observations from 1923 to 2012.
Runoff Lab NX is available for free trial on geostru.ai.